Getting started
Note
This version is archived and no longer supported. We have transitioned from the older .NET Framework-based applications to a modern .NET console application.
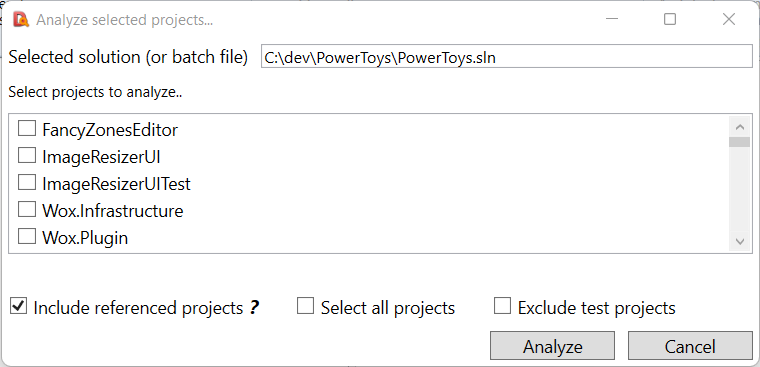
Execute the tool by executing
Designite.exeand select a C# solution file containing the projects you want to analyze.The tool will list all the C# projects in the solution; you can include/exclude individual projects for the analysis.
Once you click “Analyze”, the tool will analyze the selected projects and present a summary of the analysis. The summary includes a few important metrics, such as total lines of code in the selected projects, total classes, namespaces, and methods, total metric violations, detected design smells, the density of smells per thousand lines of code, and code duplication percentage.
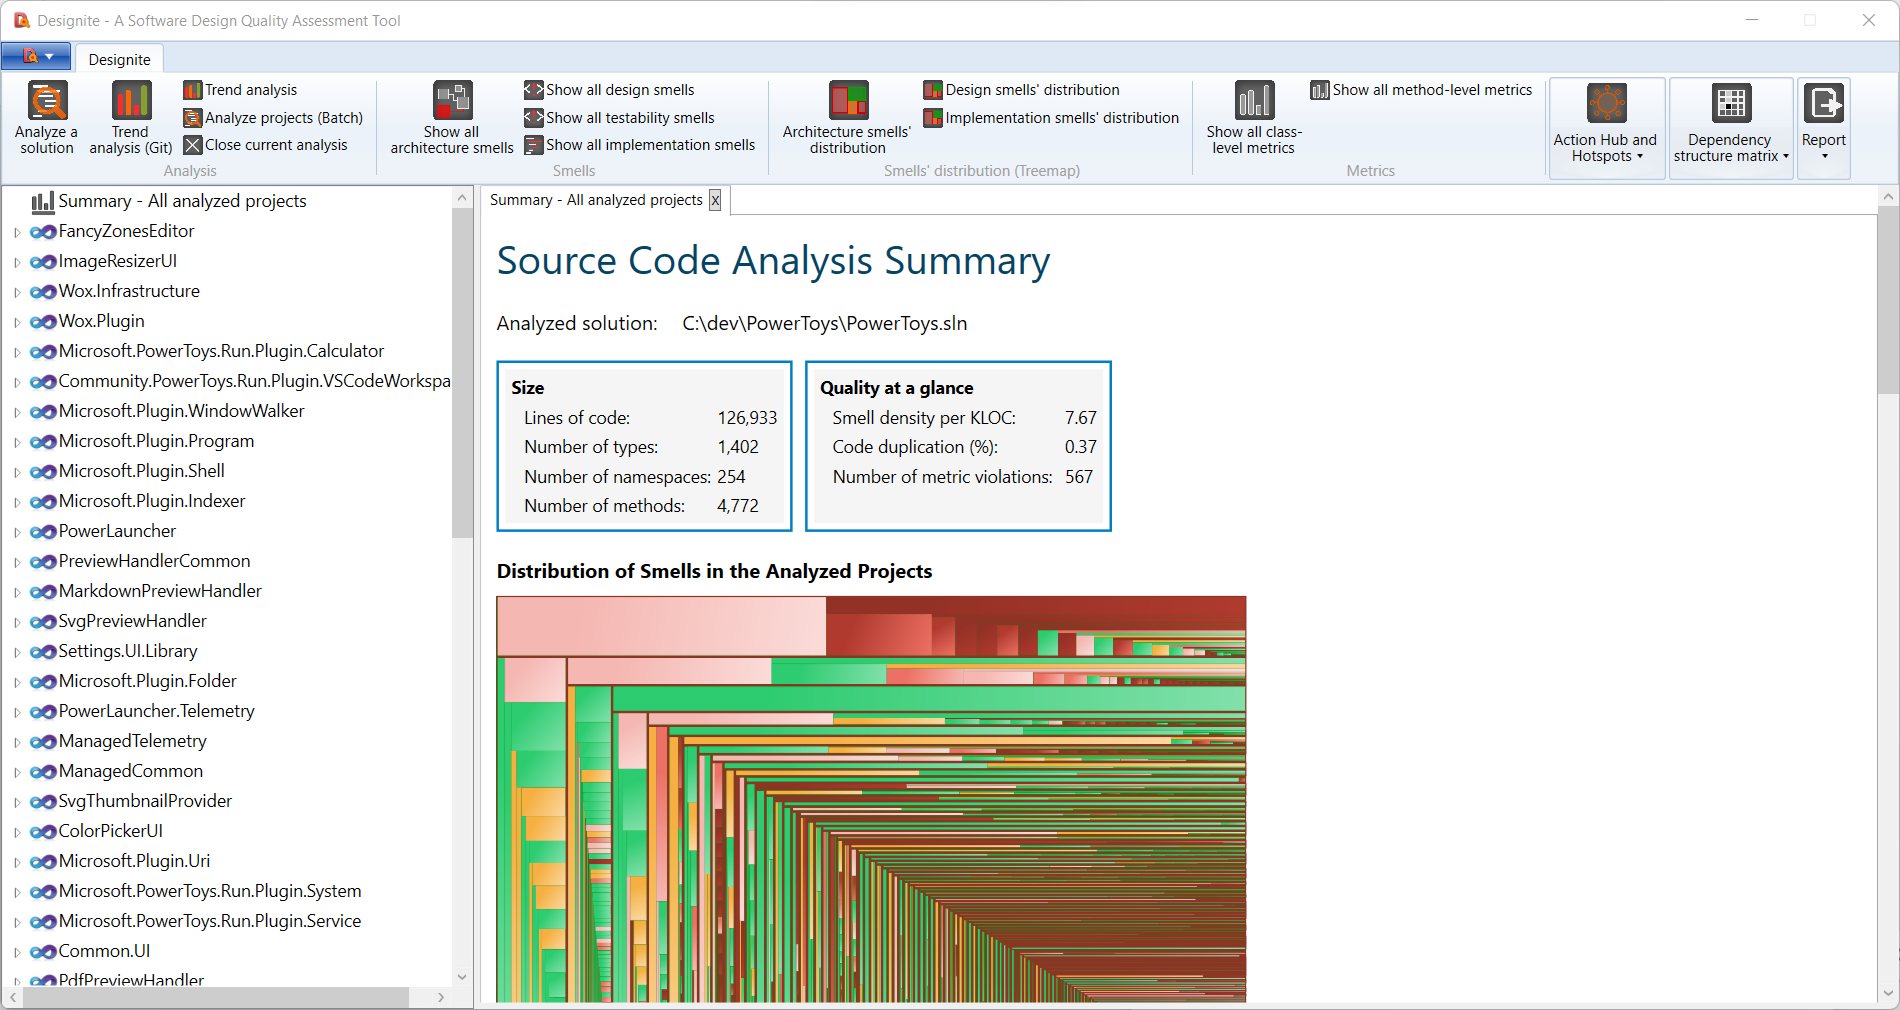
The summary page also shows the distribution of smells in the form of a treemap and two pie charts showing number of architecture and design smells. The project-specific key metrics can also be found on the summary page.
In the detailed view on the left-hand pane, you can see the detected architecture, design, implementation smells, and computed metrics in detail.
A sunburst diagram appears when you double-click smells under any analyzed projects. The sunburst allows you to navigate and filter the smells based on their violated principle, name, or originating namespace or class.
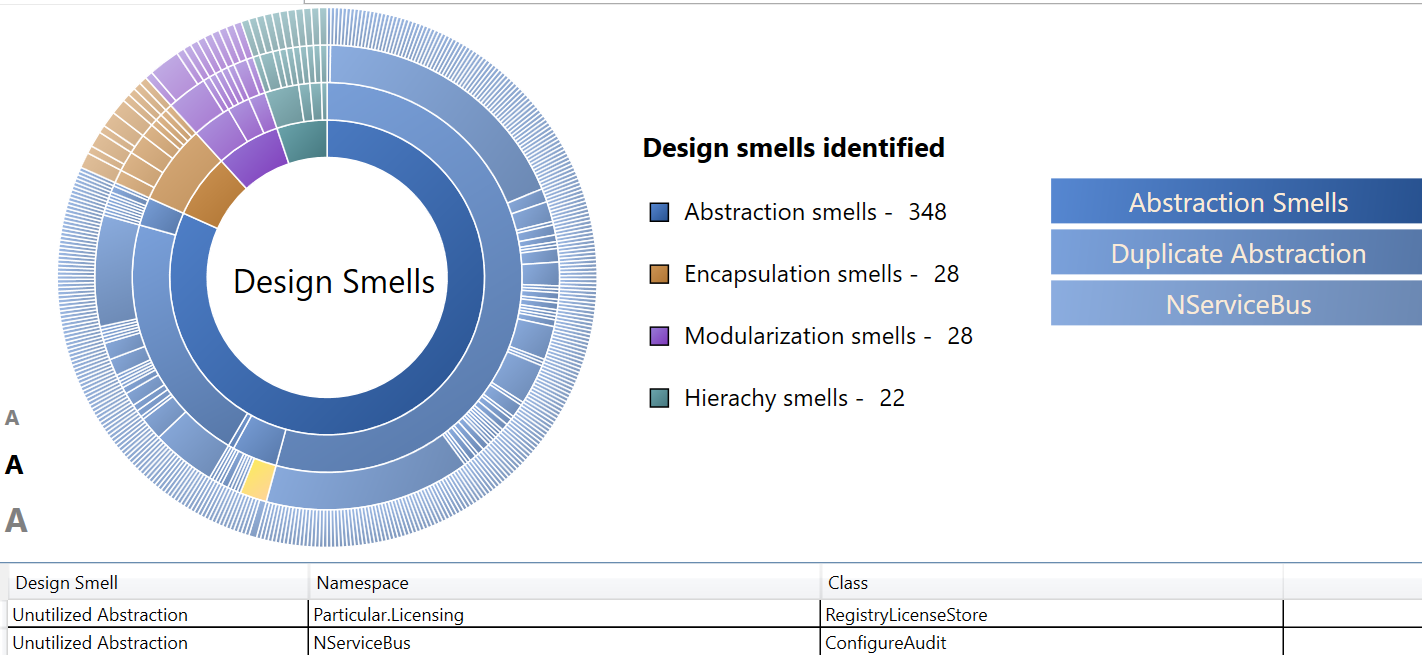
You can click on any smell to see the details of the smell (in the bottom pane) including cause and corresponding participating entities.
You can export the list of identified smells, computed metrics, and code duplication instances to an MS Excel file, CSV, or XML.